Platform & AI build
The AI Analyst that cut BI requests by 95%
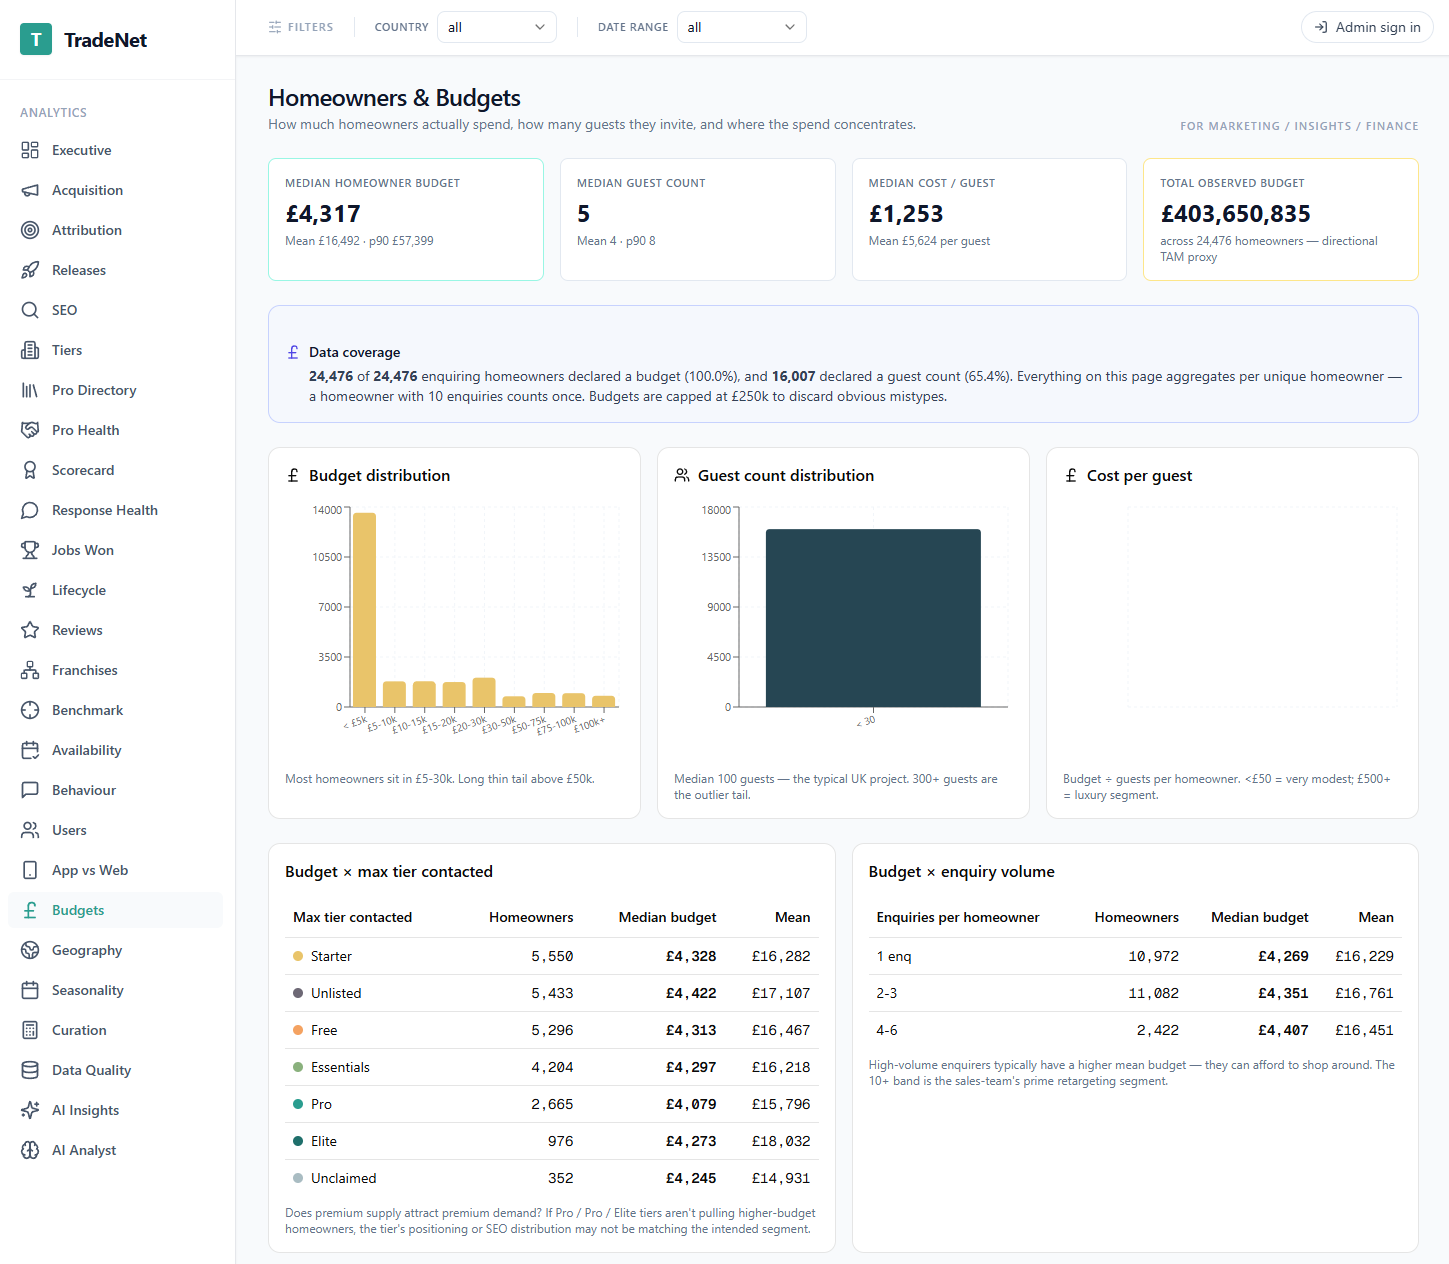
Internal analytics platform · public demo as TradeNet (fictional UK trades marketplace, synthetic data)
Read-only for guests — browse every dashboard without signing in.
The problem
Any company past a certain size has the same quiet tax: every department queues for the BI team. Marketing wants a by-channel conversion breakdown, Operations wants a churn cohort, Product wants a lifecycle view. Each of those is a ticket, an analyst's afternoon, and a two-week delay. Multiply that across a business and a large slice of decision-making ends up happening on stale numbers or gut feel.
The approach
I built a full internal analytics platform covering every department — Commercial, Marketing, Pro Success, Product, Finance, Ops — as 25+ first-class dashboards, each with its own compute function, filter controls, and KPI grid. The data model sits on a handful of source entities (signups, enquiries, timelines, pros, deployments), with a deep compute layer that every dashboard queries through a shared set of filter helpers.
The interesting part is the AI Analyst — an AI agent with five tools (list_tables, describe_table, sample, query, finish_report), read-only by design (write operations blocked before they reach the data), and a data-ref caching pattern that keeps the agent's prompt compact even when it's reasoning over ten-thousand-row results — full results are cached server-side, and only a 10-row preview goes back into the model's context.
The agent writes its own queries, iterates up to 25 tool calls per report, and persists every report with threading, follow-ups, stars, comments, tags, and optional auto-reruns on a daily / weekly / monthly schedule.
The public demo
The real platform runs on live business data and never leaves the building. To show its shape publicly, I rebuilt it end-to-end for a fictional UK home-services marketplace called TradeNet — every dashboard, every compute function, the AI Analyst included.
The demo runs on fully synthetic data: 25k pros, 40k signups, 80k enquiries, 60k timeline events, 500 deployments, 18 months of seasonal history. The generator is deterministic — every deploy produces identical numbers, so screenshots stay stable. Read-only for visitors; admin-gated writes for the AI Analyst surface.
Outcome
BI request volume dropped by over 95%. Report accuracy went up in parallel, because the agent queries live source-of-truth data rather than relying on someone interpreting a brief third-hand. The platform now serves every department, and analyst time shifts to the strategic work instead of "can you pull me a number".
The TradeNet demo is a faithful public-facing mirror of that platform — same dashboards, same compute, same AI Analyst — on fictional data so anyone can click around.